
Yesterday, we took some time to [show off the new control interface](http://www.wufoo.com/2009/06/16/sneak-preview-new-report-builder-controls/) for the redesigned Report Builder we’re prepping to go live soon. One of the steps in the report creation process we didn’t go over yesterday was the 4th step, which focuses on each of your report’s widget settings. Just as a form in Wufoo is made up of different types of fields to take in input, a Wufoo report is made up of a collection of widgets that process and visualize that data.
In the new Report Builder, there will be 5 types of widgets (Graphs, Charts, Numbers, Text and Datagrid) that you can add, mix and match in your reports. Because each widget type is uniquely different in their presentation and function, they have their own unique set of features and settings. The following is a look at the redesigned interface settings we’ve created for each report widget in the new Report Builder.
**Graph Settings**
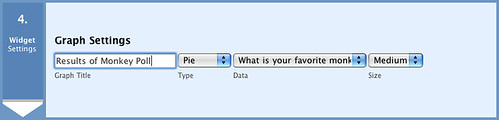
These graph settings will be very familiar to those familiar with the old Report Builder. We’ve added a twist to one of the graph types, but we’ll talk about that in another post.
**Chart Settings**
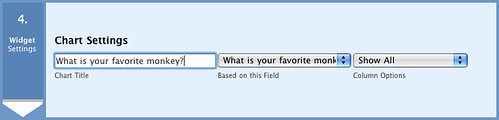
One feature we’ve added to our [Field Charts](http://www.wufoo.com/2009/04/14/more-field-chart-goodness/) is the ability to selectively show certain columns if it’s using a Field Chart type that’s dedicated to showing choices. The column options will allow you to choose between All Columns, Percentage Only and Count Only.
**Number Settings**
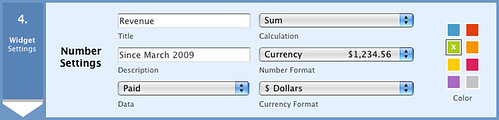
The Number Settings work and feel just like our old Big Number settings, but with a different arrangement to enhance clarity and take better use of the space in the controls.
**Datagrid Settings**
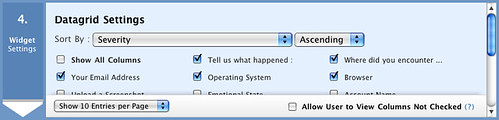
One of things we’ve done with the new datagrid settings is do a much better job of separating the fields from the entry specific information (ie. Date Created, IP Address, etc.) and payment information (ie. total, status, merchant, etc.). This will make choosing the appropriate data to highlight a lot easier. We’ve also added a new feature that allows you to specify ahead of time which column to sort your datagrid ahead of time and whether you want it sorted in ascending or descending order. Because the datagrid widget is a resource intensive and complicated data browsing tool, you will only be able to have one datagrid on a report at a time.
**Text Settings**
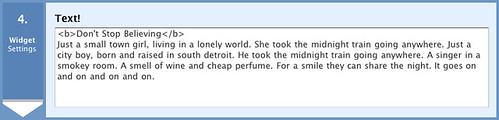
This is a new widget type that we’ve added to the new Report Builder to add flexibility to the system. You can now easily add static text to your reports to help explain your data to your users. As you can see here, you can supplement the formating of this text with standard HTML.