
Last month, we added [Field Charts](http://www.wufoo.com/2009/03/10/new-report-widgets-field-charts-and-big-numbers/) to the line up of visual elements available to your Wufoo reports. It’s been so much fun watching you guys use them to illustrate your fields that have choices that we’ve been working hard behind the scenes to both expand the depth and breadth of these static data representations.
###Field Charts Now Available for More Fields
When we launched Field Charts, they were only available for **Multiple Choice, Checkbox, Drop Down** and **Single Line Text** field types. For users wanting to take advantage of these horizontal graph representations for other fields, we’ve also added the ability to use them with **Number, Date, Price, Web Site** and **Time** fields.
###Extended View
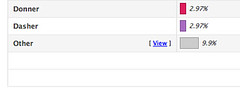
On Field Charts that contain data with lots of choices, we’ve been compiling the information to show the 7 most popular choices and representing the rest as an **Other** bar at the bottom of the chart. Thanks to our new extended view for field charts, a link to drill down and view this data can now be seen next to these Other groupings.
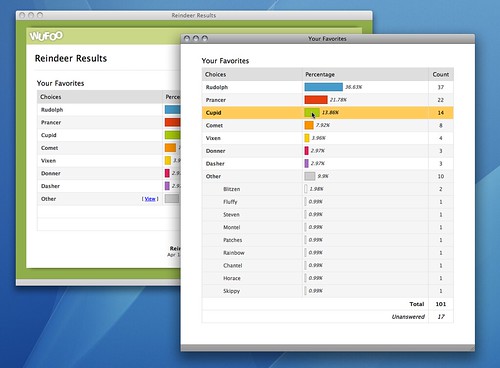
Now, if you want to view more detail about those other choices, you can click on the **View** link to see a detailed pop up view of that field chart’s data.
###Additional Field Chart Types
We’ve also been thinking about ways to bring Field Charts to other fields. Because we realize showing the most popular choices in a horizontal bar chart form isn’t the most appropriate view for all fields, we’ve created a grid-like view to represent these fields in alternate ways.
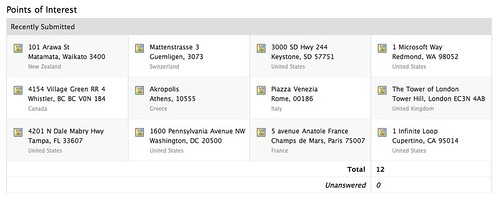
For example, phone number entries are, for the most part, always pretty unique in a dataset. For this reason, you probably don’t want to see a bar chart of the most popular phone numbers. In fact, you’d be better served seeing a static table of your most recently submitted numbers, which is what we’ve done for these fields. Here’s some examples of the alternate views we’ve created for these field charts:
**Paragraph Field Chart**

**Address Field Chart**
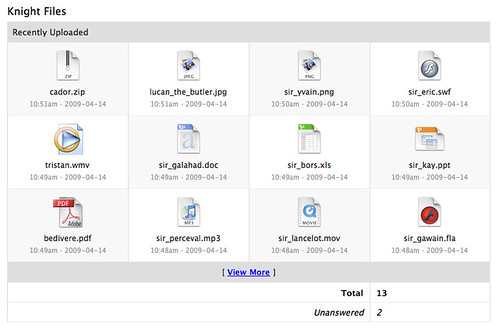
**File Upload Field Chart**
This grid view is automatically created when you choose a Field Chart for any of the following field types: **Address, Email, Name, Phone, File** and **Paragraph Text**. These field charts also have extended views that let you page through and navigate this data in external pop up windows.
These additional field charts are live right now in the Report Builder and are available to all users across all plans (except for the File Upload field chart, which requires your plan to be able to accept file uploads). Thanks to everyone that’s been playing with these new visualizations and we hope we’ll be able to bring some more of these cool widgets soon.